Posts

Nueva prueba Molodensky-Badekas con gvSIG 2.0.0 (Venezuela, de Canoa a Regven)

He comprobado que el resultado coincide con el de Cartogeo. Estas instrucciones son para Windows. Para Linux se deben usar enlaces de descarga diferentes (solo hay que explorar la carpeta desde la que se hacen las descargas): - Instalar gvSIG 2.0.0. Lo puedes descargar aquí . - Añadir el plugin de Molodensky-Badekas. Lo puedes descargar aquí . - Crear una subcarpeta llamada "molodensky-badekas" en la carpeta de usuario "gvSIG". En Windows 7, es así: C:\Usuarios\[usuario]\gvSIG\molodensky-badekas\ - En esa carpeta, debes copiar este archivo que tiene los parámetros Canoa-Regven. - Finalmente, haz lo mismo que se ve en este vídeo .

Cartogram showing economic weight of Spain's regions in 2013

Image
Source: INE

Toying with Barnsley's fractal fern (recursive vector version, not probabilistic)

Image
Recursive algorithms and trigonometry are not necessarily boring and ugly! - Click to see full version.

Tokyo shifted by 3 meters on Google Maps, possibly due to the 2011 earthquake

Image
In a previous post , I included a screenshot of Tokyo on Google Maps with an arrow and the coordinates associated with it before the March 11, 2011 earthquake. The USGS said that the whole Honshu island (where Tokyo is located) was shifted by about 8 feet (2.4 meters) during the earthquake. Now we can ask Google Maps to place the same arrow on the map again (their imagery is likely to have been updated in these years) and voilà! , Tokyo seems to have moved northwards by about 3 meters. It might be a coincidence, but I don't think so: Before: After: You can simply copy-paste these coordinates inside the Google Maps search box: 35.6821332,139.752048
Computing on the fly a reasonable layout for map legends

Image
For a given vector layer legend and a user-defined rectangle (established with mouse events: mouse down + dragging + mouse up) we need to compute the location and size of the area for each legend sample item. Our goal is simply having a nice-looking legend box like this one: So the parameters whose values we must compute automatically are: Number of columns Width ( w ) and height ( h ) of each sample item (the same for all) How many items we are going to draw (not necessarily all items available in the legend) We'll start by stating the criteria that will guide our little algorithm: The w/h ratio will be 8 at most. If we need to truncate a label to achieve this, we'll do. The font size and number of columns will be chosen so that available room is used in the best way. If h is less than 3 mm, we'll reduce the number of items included, but we must include all items if the total number of items available in the legend is 20 or less. If we cannot achi

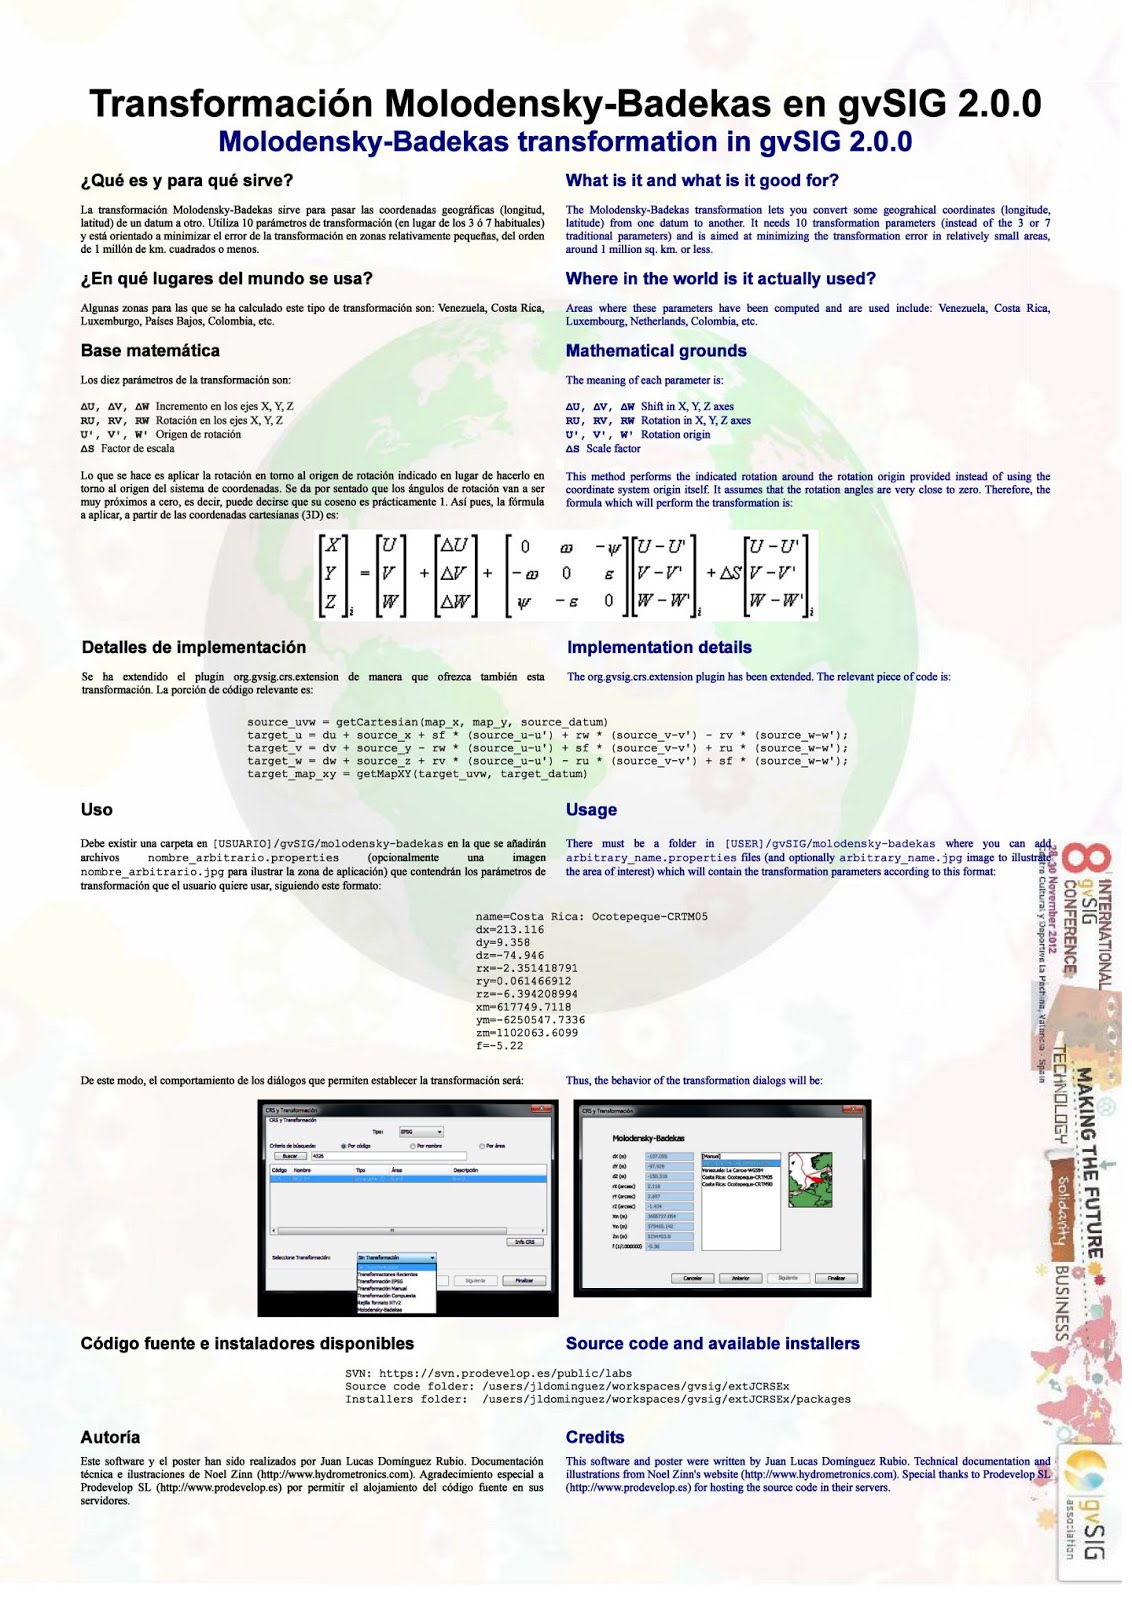
Molodensky-Badekas transformation in gvSIG 2.0.0

Image
What? Providing a way to perform the 10-parameter Molodensky-Badekas transformation (useful in the Netherlands, Venezuela, Costa Rica, etc.) How? Extending the extJCRS plugin, by providing the missing computations in pure Java. Usage? User provides text file with parameters and optionally an image to illustrate area of interest. Show me! Click image to enlarge or get poster in [PDF] and [OpenOffice] formats.